Green Screens, Red Eyes: The Quiet Dread of the Always-On Dashboard
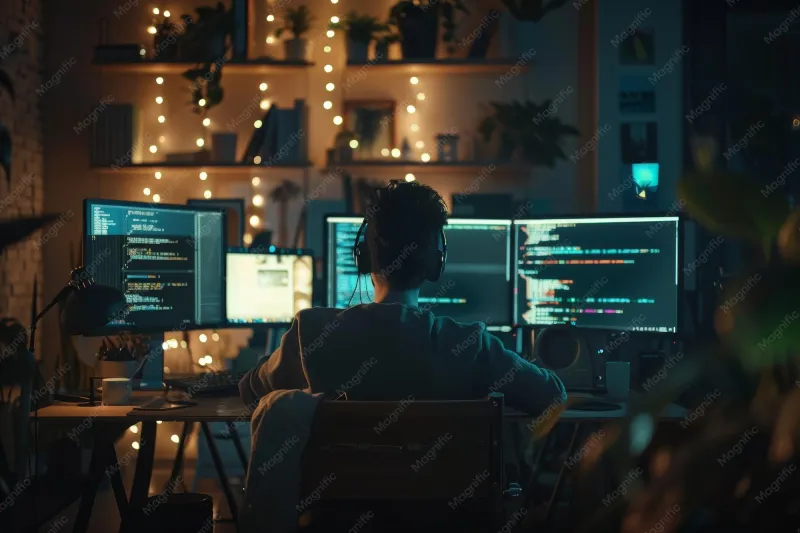
Photo: developer monitoring dashboard dark room multiple screens night, via img.freepik.com
There's a specific kind of silence that comes with a dashboard showing all green. No alerts, no spikes, no little yellow warning triangles. Just smooth lines rolling across the screen like a heart monitor on a very healthy patient.
Ask any on-call engineer and they'll tell you: that's when you start worrying.
The Dashboard That Watches You Back
Production monitoring has a strange psychology to it. You spend weeks building the thing — uptime checks, latency graphs, error-rate counters — and then you spend the rest of your career dreading the very notifications it sends you. It's like installing a smoke detector that texts you at 3 a.m. in a voice that sounds suspiciously like your own.
One backend developer in Denver put it to me this way: "The dashboard doesn't sleep, so I don't really either. Not fully. There's always a phone on the nightstand, face up, volume on."
That phone is the real product. The graphs are just its alibi.
Tuning Thresholds at Midnight
Every alert has a threshold, and every threshold has a story. Set it too tight and you get paged because a cron job hiccuped in Ohio. Set it too loose and by the time your phone buzzes, customers have already been tweeting at you for twenty minutes.
So engineers fiddle. They tune at midnight, sometimes from bed, sometimes from a wedding reception. One SRE I spoke with described adjusting alert windows from her phone while waiting in line at a Costco food court. "P90 latency crossing 400 milliseconds for five minutes," she said. "That number used to be 500. It used to be ten minutes. We've all been burned."
The dirty secret of monitoring is that thresholds aren't engineering decisions. They're emotional ones. They encode every past incident, every embarrassing outage, every 3 a.m. wake-up that turned out to be nothing — or worse, something.
Why 'All Green' Feels Like a Lie
Here's the part nobody puts in the onboarding docs: a fully green dashboard can be more anxiety-inducing than a red one.
Red means you know where the problem is. Green might mean everything is fine — or it might mean your instrumentation broke an hour ago and you're staring at a beautiful chart of absolutely nothing. Veteran engineers learn to spot-check the monitoring system itself. Is the data fresh? Is anything actually reporting? Is the check that verifies the checks still running?
It's turtles all the way down, and every turtle needs a heartbeat monitor.
There's also the quieter problem: green can mean your users gave up. Traffic dropped because the checkout button broke, and error rates fell because nobody's hitting the endpoint anymore. The dashboard says healthy. The revenue graph, elsewhere, says otherwise.
The Humans Behind the Pagers
Spend enough time around on-call rotations and you notice the rituals. Engineers who silence notifications during dinner but keep one earbud in. Teams that draw straws — or lose coin flips — for weekend duty. The unofficial rule that whoever merges on Friday owns whatever breaks on Saturday.
And yet, most of them wouldn't trade it. There's a strange pride in knowing your system's resting heart rate. One developer described his monitoring setup the way you'd describe a classic car: "It's loud when something's wrong, quiet when it's not, and I know every sound it makes."
That's the relationship, really. The dashboard isn't software. It's a pet that never sleeps and occasionally screams.
Toward a Calmer Kind of Watching
The tools are getting smarter. Anomaly detection is getting better at separating real incidents from Tuesday noise. Some teams are experimenting with AI agents that triage alerts before a human ever sees them, summarizing the 2 a.m. fire down to a 7 a.m. note that says, "Handled. Here's what happened."
That's the dream, anyway: dashboards that watch so you don't have to. Alerts that respect your sleep. Monitoring that knows the difference between a blip and a bonfire.
Until then, the phones stay face up. The thresholds stay tuned. And somewhere in America, an engineer is staring at a wall of green, feeling great — and feeling just a little bit suspicious.